
Figure 2.
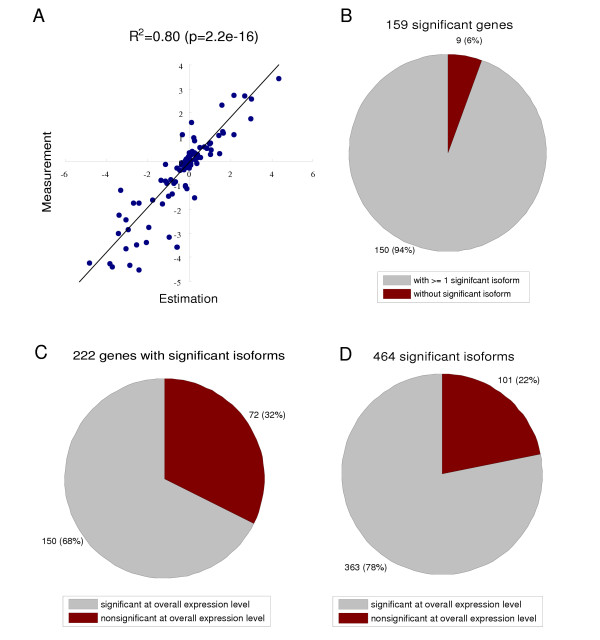
Profiling splice isoforms provides additional useful information for prostate cancer classification. (A) The validity of estimating the overall mRNA abundance level from the isoform abundance level. The overall mRNA level was estimated by summing up the abundances of individual isoforms for each gene. The estimated mRNA abundances of 107 genes were compared with direct measurements by an independent expression microarray design (described in main text). Plotted are the scatter-plot of log expression ratios of these genes in two prostate cancer cell lines, LNCaP and PC-3. These two approaches show good agreement (R2 = 0.80, p = 2.2e-16). (B) 159 genes out of 364 profiled genes in the DASL assay exhibit differential expression between tumors and normal samples at the overall mRNA level (q-value = 0.05). Most of them (92%) have isoforms with significant differential expression. (C and D) 464 isoforms from 222 genes are reported as being differentially expressed between tumors and normal tissues (q-value = 0.05), which may be prostate cancer marker candidates. 32% of these genes (corresponding to 22% significant isoforms) do not show differential expression at the overall mRNA level, therefore can not be detected by conventional microarrays.