
Fig. 2.
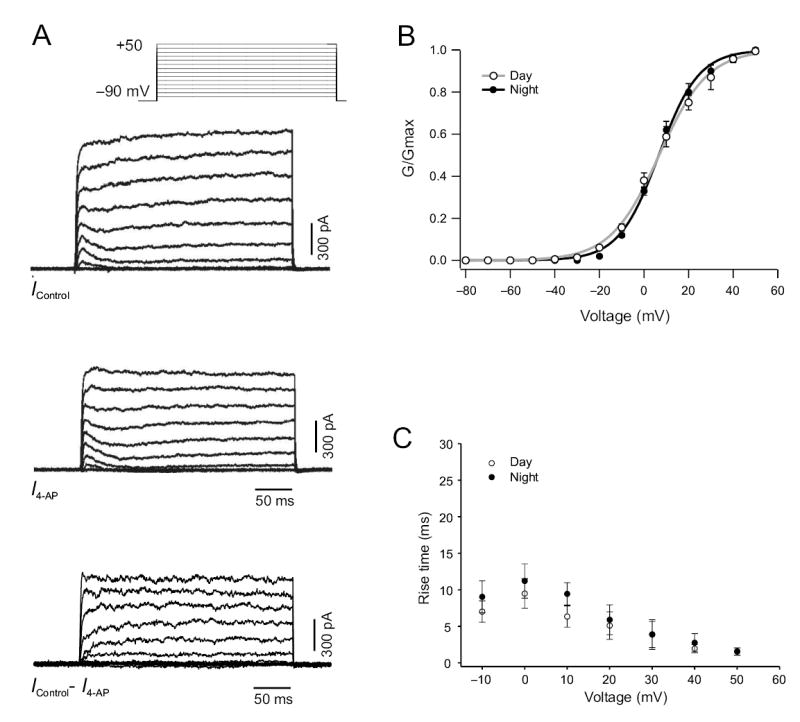
Characterization of fDR K+ currents in SCN neurons. (a) Icontrol current traces were generated by using the voltage step protocol with a prepulse potential of −90 mV and test pulse potentials ranging from −80 to +50 mV (10 mV increments, bottom). I 4-AP current traces were generated using the same protocol after 5 min treatment with 0.5 mM 4-AP. Bottom trace shows example of a fDR current trace isolated by subtracting I 4-AP from I control. (b) Activation curves generated in dSCN neurons during the day and night by applying a hyperpolarizing prepulse (100 ms at −90 mV) followed by 900 ms voltage pulses at progressively depolarized potentials (−80 to +40 mV, 10 mV steps). (c) 20–80% rise time measurements for fDR currents recorded during the day and night.