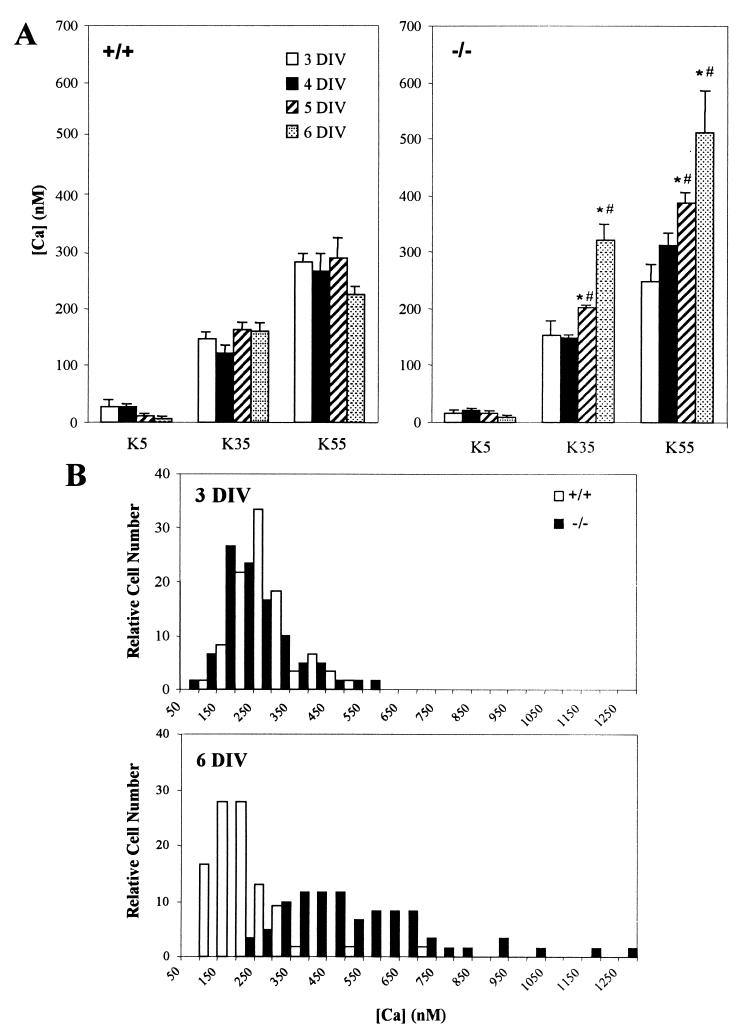
Figure 5.
(A) Calcium measurements in mutant and normal CGN subjected to different K+ concentrations. After 3–6 DIV, [Ca2+]i was measured ratiometrically with fura-2 fluorescence after placing cells in different concentrations of KCl. Whereas the normal (+/+) cells (Left) showed no increase at any DIV with rising K+ concentrations, mutant (−/−) cells (Right) showed progressive increase of [Ca2+]i with development at 35 and 55 mM KCl (*, P < 0.05 comparing [Ca2+]i at 5 and 6 DIV with that at 3 DIV for the same KCl). In addition, [Ca2+]i levels were higher in the mutant than the normal cells at 35 and 55 mM KCl after 5 and 6 DIV (#, P < 0.05) comparing [Ca2+]i in mutant cells with those in normal cells at same DIV and KCl). (Bars = SD; n = 3.) Note that the low levels of [Ca2+]i at 5 mM KCl are in general agreement with those reported for similar cultures of rat CGN (50). (B) Frequency distribution of [Ca2+]i in normal and knockout CGN at 55 mM KCl after 3 and 6 DIV. Whereas little difference was seen at 3 DIV, virtually all of the mutant cells possessed higher [Ca2+]i than normal cells at 6 DIV. Data are presented as percentages in each group of ∼60 cells measured.

