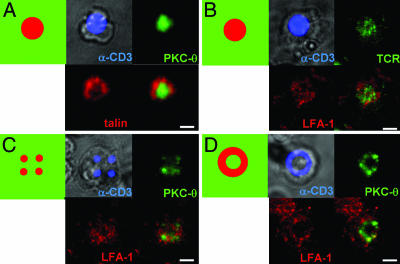
Fig. 5.
Synapse array patterns template T cell surface receptor and intracellular signaling molecule accumulation at the cell–surface contact site. Shown in each panel are schematics of the anti-CD3/ICAM-1 substrate pattern and representative immunofluorescence images at the cell–substrate contact plane of OT-II CD4+ T cells fixed 20 min after seeding on synapse surfaces. (A and B) Immunostaining of PKC-θ (green) and talin (red) (A) or TCR and LFA-1 on focal anti-CD3 patterns (B). (C and D) Immunostaining of PKC-θ (green) and LFA-1(red) on multifocal patterns (each anti-CD3 spot 2 μm in diameter) (C) or annular anti-CD3 patterns (D). (Scale bars: 5 μm.)

