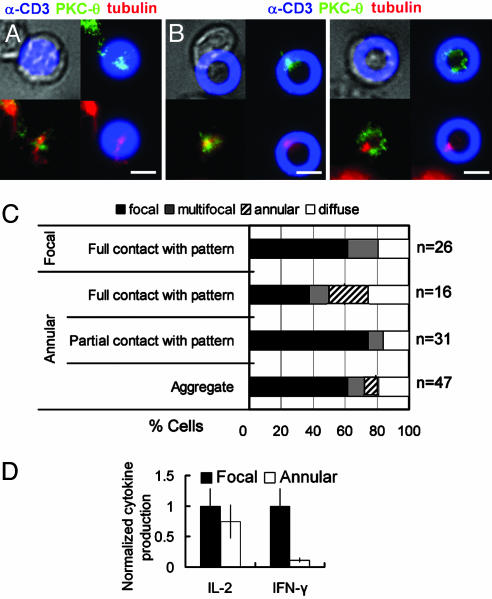
Fig. 6.
T cell responses to focal vs. annular anti-CD3 activation sites. (A and B) Representative micrographs of 5C.C7 CD4+ T cells interacting with focal and annular activation sites, respectively. Overlays show DIC/activation site fluorescence (Upper Left), PKC-θ/activation site fluorescence (Upper Right), PKC-θ/tubulin (Lower Left), and tubulin/activation site fluorescence (Lower Right). (Scale bars: 5 μm.) (C) Quantification of PKC-θ clustering morphologies. (D) IL-2 and IFN-γ secreted by 5C.C7 T cells cultured on focal vs. annular activation site patterns after 48 h, normalized by cytokine concentrations secreted on focal patterns (average ± SEM from three independent experiments).

