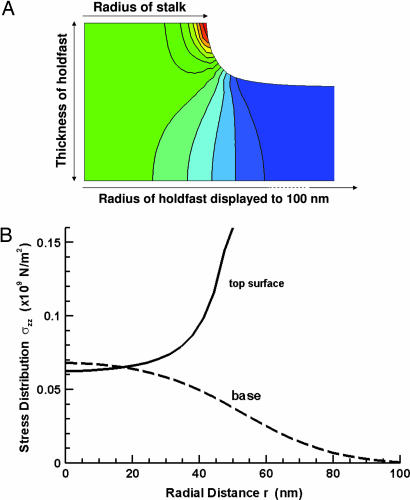
Fig. 4.
Numerical finite element method simulation of stress and deformation on holdfast material. (A) The contour plot shows level curves of the tensile strength component σzz throughout the axially symmetric configuration with red to blue representing magnitudes from highest to lowest. (B) The solid curve (labeled top surface) shows the normal stress exerted in the disk by the stalk over the planar contact surface. The dashed curve (labeled base) shows the normal stress exerted by the rigid glass substrate on the base of the disk from equilibrium. The resultant forces of these two distributions are equal.

