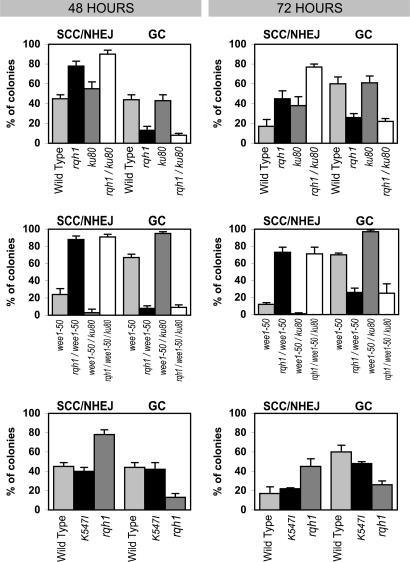
Fig. 2.
Bar graphs showing comparisons in GC and SCC/NHEJ frequencies in various genetic backgrounds. Each bar represents an average of a minimum of three individual experiments. (a) Comparison of SCC/NHEJ and GC rates among Th805 (wild type), Th805 Δrqh1 (rqh1), Th805 Δpku80 (pku80), and Th805 Δrqh1 Δpku80 (rqh1 pku80). (b) Comparison of Th805 wee1-50 (wee1-50), Th805 Δrqh1 wee1-50 (rqh1 wee1-50), Th805 Δpku80 wee1-50 (rqh1 pku80), and Th805 Δrqh1 Δpku80 wee1-50 (rqh1 pku80 wee1-50). (c) Comparison of Th805 (wild type), Th805 Δrqh1 (rqh1), and Th805 rqh1-K547I (rqh1 K547I).

