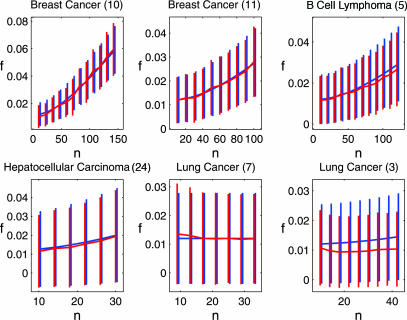
Fig. 2.
The mean overlap f*n as a function of the number of samples, for six different data sets, for α = 0.012. The vertical bars indicate one standard deviation. Analytic estimations are in blue, and the results of simulations are in red. For each data set, the range of n for which results are presented reflects the number of samples of the particular experiment. Numbers in parentheses refer to the reference from which the data were taken.

