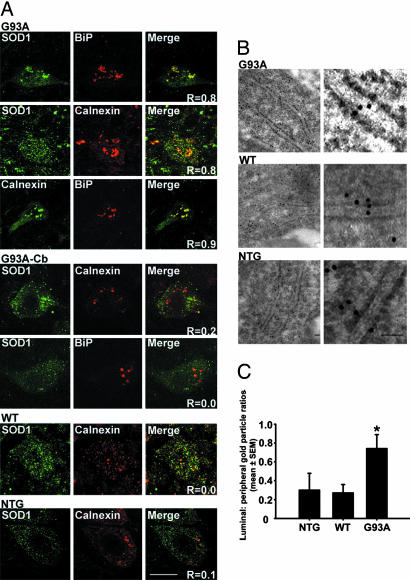
Fig. 3.
Microscopical demonstration of ER location of SOD1 in spinal motor neurons. (A) Immunoflourescence analysis of SOD1 colocalization with ER markers calnexin and BiP in spinal cord and cerebellar sections. (Scale bar, 20 μm.) (B) Luminal ER labeling of SOD1 in immunoelectron microscopy. (Scale bar, 50 nm.) (C) Quantification of gold particles inside the ER lumen and in the ER periphery. Values represent means ± SEM (n = 23–30 ER profiles per group). ∗, P < 0.05; one-way ANOVA, Student–Newman–Keuls method.

