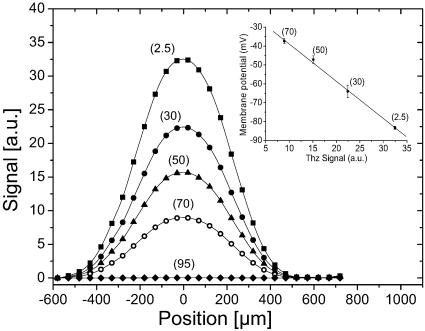
Fig. 2.
Terahertz imaging of the same axon bathed in a physiological (millimolar) solution containing increasing [K+]0: 2.5 mM (squares), 30 mM (filled circles), 50 mM (triangles), 70 mM (open circles), and 95 mM (diamonds), with an aperture diameter of 200 μm. The delay remained fixed, and the spatial stepping size was 50 μm. (Inset) Linear dependence exists between the terahertz signal and the membrane potential recorded by using intracellular microelectrodes. Figures associated to each points correspond to tested [K+]0. Vertical bars show the standard deviation of measurements on six different axons. Solid lines are fits from numerical simulations.

