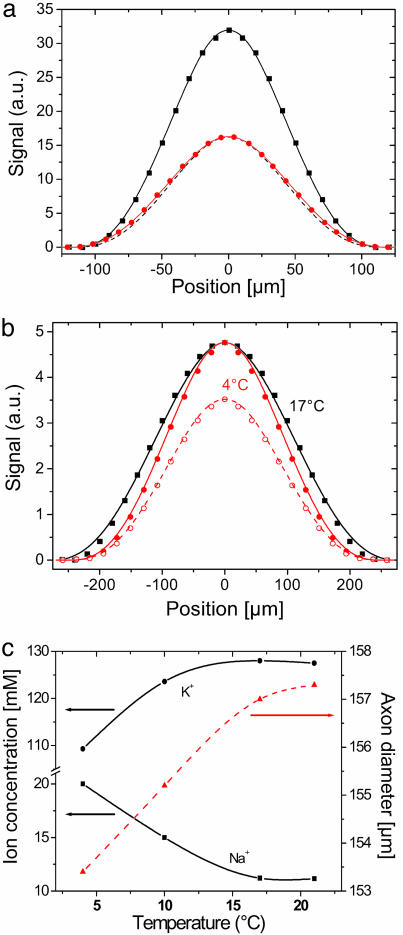
Fig. 4.
Effect of axonal Na loading. (a) Effect of Na-channel activator. Scans of neuron bathed in physiological solution before (black squares) and 2 h after (red circles) veratridine (5 μM) addition. The change in neuron profile due to veratridine is emphasize by the dotted line, which is proportional to the reference scan. The axon diameter increase ratio was 1.112 ± 0.001 (from 70 to 78 μm) and corresponds to an influx of 0.91 ± 0.01 pl/μm neuron. The aperture diameter was 100 μm, and the spatial stepping size was 10 μm. Fits (solid lines) are from FEM simulations. (b) Effect of temperature change. Axon profiles data recorded at 4°C (red circles) and 17°C (black squares). To visualize the profile change due to diameter increase when temperature rises, original data at 4°C (open circles) were also normalized (filled circles). Here, the aperture diameter was 200 μm, because the axon diameter was larger than the one in a, and the spatial stepping size was 20 μm. Line-fits were obtained from FEM simulations. (c) Axon diameter, and [K+]i and [Na+]i concentrations versus temperature, extracted from neuron profiles. The relative axon diameter increase was 1.025 ± 0.001 (from 153 to 157 μm), simultaneously with an influx of potassium and efflux of sodium. The overall water influx was 0.93 ± 0.01 pl/μm.

