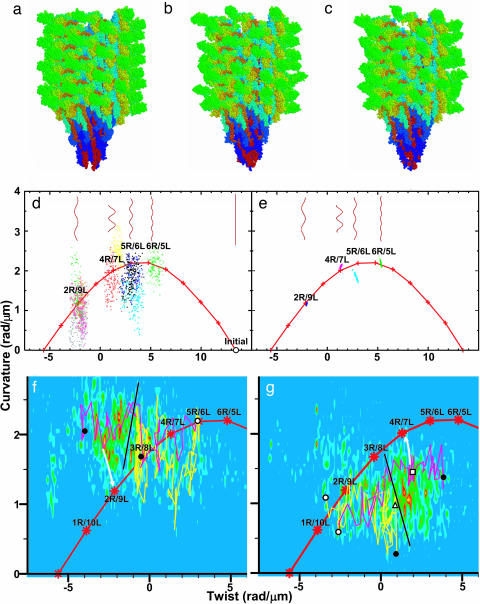
Fig. 1.
Simulated models of flagellar filaments and helical parameters of WT filaments in the twist–curvature diagram. (a) Initial structure for simulation. (b and c) Snapshots of normal (b) and semicoil (c) during simulation. (d) Helical parameters of metastable structures of 10 distinct MD trajectories (last 150 ps). Red “+” connected by lines indicates parameters expected from the bistable protofilament model. Long filaments consisting of 10,680 subunits are also shown (see Materials and Methods). (e) Structures of randomly generated long filaments. (f) Results of force–bias MD starting from right- toward left-handed supercoil. Magenta (Movie 1) and yellow (Movie 2) lines represent results obtained for a torque of 5.0 and 2.0 × 10² pN·nm, respectively. Density map shows probability determined from 11 trajectories that reached near 2R/9L or 1R/10L. White circle, initial structure; black circle, final structures; black line, probable position of energy barrier; white arrow, expected relaxation pathway. (g) Same as f but in the opposite direction. The magenta (Movie 3) and yellow (Movie 4) lines represent the results for a torque of 4.0 and 2.0 × 10² pN·nm, respectively. Density map was determined from 34 trajectories that reached near 4R/7L or 5R/6L. White triangle and square, transient structures experimentally observed (9). Figs. 1 a–c, 2b, and 3 were created with rasmol (37).

