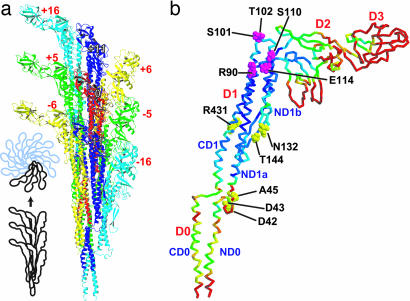
Fig. 2.
Subunit arrangement in the filament viewed from outside (a) and structural variation of subunits (b). In b, rms differences of Cα atom positions among different protofilaments are shown by colors mapped on the Cα trace; highly flexible regions are in warmer (red) colors. Residues in the CPK model (magenta and yellow) are involved in permanent interactions. a was created with molmol (38).

