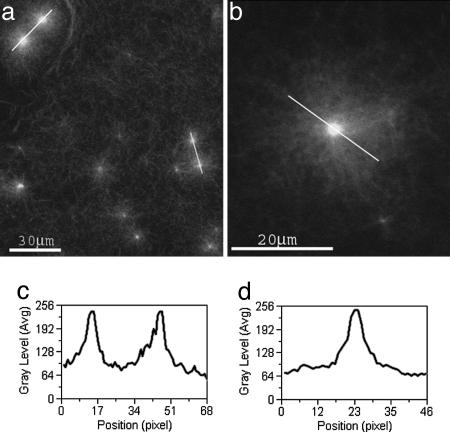
Fig. 1.
Confocal images of asters. Conditions were actin monomer (3.78 μM), GST-VCA (50 nM), and Arp2/3 complex (25 nM). (a and b) Individual asters and aster pairs (marked by white lines in a) are observed. (c) The intensity profile of actin fluorescence along an aster pair (right aster pair) is plotted. Typically, the two asters are almost identical in size and actin content. (d) The intensity profile of the fluorescence, I(r), is plotted along an aster (marked by a black line) versus the radial distance r from the aster center. I(r) decays symmetrically as a function of r from the aster center to the periphery.

