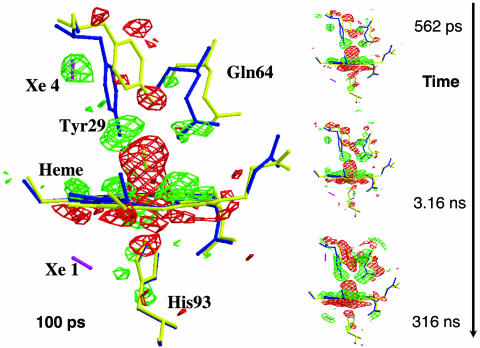
Fig. 1.
Structural changes in the heme vicinity of YQR-Mb detected at 0.1–316 ns after CO photolysis; the time frames at 316 ps and 1 ns are not shown. (Flight − Fdark) difference electron density maps (red: negative; green: positive; contoured at 3.0 σ, where σ is the standard deviation of the electron density difference) are overlaid on models of YQR-MbCO (yellow, Protein Data Bank code 1MYZ) and YQR-Mb (blue, Protein Data Bank code 1MZ0). For clarity, a magenta bar indicates the position of CO in both the Xe1 and Xe4 pockets.

