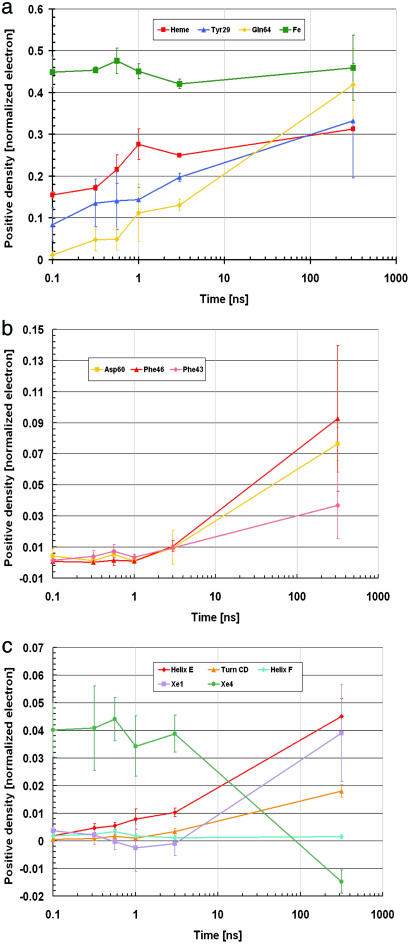
Fig. 2.
Time dependence of difference electron densities for key structural features. The numerical values reflect the integral of the positive electron density beyond 3.0 σ and are corrected for variations in photolysis yield. They are normalized so that the negative bound-CO feature is assigned a value of 1. Average values weighted by photolysis yield over the four independent data sets are shown. Error bars correspond to twice the weighted standard deviations between data sets. (a) Key features that appear promptly. (b) Residues involved in the strain of the CD turn, lagging behind. (c) Population of CO in the Xe1 and Xe4 sites and changes in secondary structures; in the latter, the average integrated density per residue is shown.

