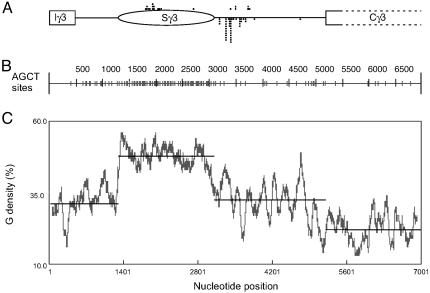
Fig. 4.
Plots of the downstream edge of the R-loops, the G density, and the AGCT locations for murine Sγ3 through the initial portion of the first constant exon. (A) The relative position of the 482-bp Iγ3 exon, the 805-bp Iγ3–Sg3 intervening region, the 1,801-bp Sγ3, the 2,080-bp Sγ3–Cγ3 intervening region, and the first 1,801 bp of the Cγ3 region (exon/intron boundaries not specified) are shown. R-loop downstream boundaries based on Figs. 1 and 2 are shown as dots above or below the line, respectively. (B) The AGCT plot of the sequence in A. The short vertical bars on the plot indicate the AGCT sites. (C) The G density plot of the sequence in A.

