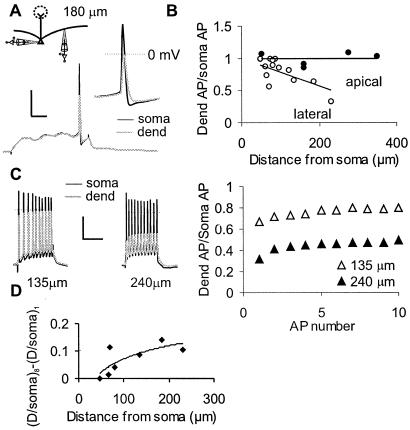
Figure 6.
AP propagation in mitral cell lateral dendrites in vitro. (A) Simultaneous whole-cell recordings from the soma (black line) and a lateral dendrite (180 μm from the soma, gray line) of a mitral cell show that APs in the lateral dendrite are smaller than those recorded in the soma. [Scale bar indicates 25 mV and 20 ms (5 ms for Inset).] (B) The summary graph shows the ratio of the dendritic-to-somatic AP amplitude for lateral dendrites (○; n = 12) and apical dendrites (●; n = 5), plotted as a function of distance from the soma. Lines show the best linear fit. (C) Data from a single cell show that the amplitude of somatic APs attenuates throughout a high-frequency train, whereas the amplitude of APs recorded in the lateral dendrite (at two locations) increases. (Scale bar indicates 25 mV and 60 ms.) (Right) The ratio of dendritic to somatic AP amplitude in lateral dendrites increases with AP number, and this increase is larger at the distal location. (D) Data from seven cells show the difference between the propagation ratios for the eighth and the first AP in a train. This difference increases with the distance from the soma.

