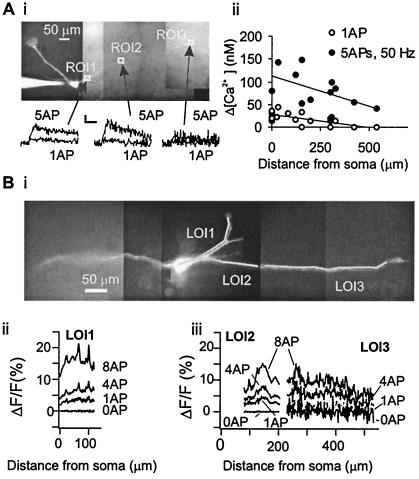
Figure 7.
AP-dependent Ca2+ transients in mitral cell dendrites recorded in vitro. (Ai) Fluorescence image of a mitral cell filled with the calcium indicator Fura-2 (50 μM). (Upper) Ca2+ transients evoked by one and five APs (at 50 Hz) recorded from indicated regions of interest (ROI) show the attenuation of the Ca2+ transient with distance along the lateral dendrite. (Scale bar indicates 20 nM Δ[Ca2+] and 100 ms.) (Aii) Peak Δ[Ca2+] evoked by one and five APs (at 50 Hz) plotted against the distance along the lateral dendrite at which it was recorded (n = 19 ROI from 13 cells). Lines indicate the best linear fit to data. (Bi) Fluorescence image of a mitral cell filled with calcium orange (50 μM). Lines of interest (LOI1, LOI2, and LOI3) indicate the regions of the dendrite where fluorescence measurements (in Bii and Biii) were made. (Bii and Biii) ΔF/F measured along LOI1, LOI2, and LOI3 plotted against distance from the soma for the indicated number of APs (0, 1, 4, or 8). Data were collected over an interval of 67–134 ms after the last AP.

