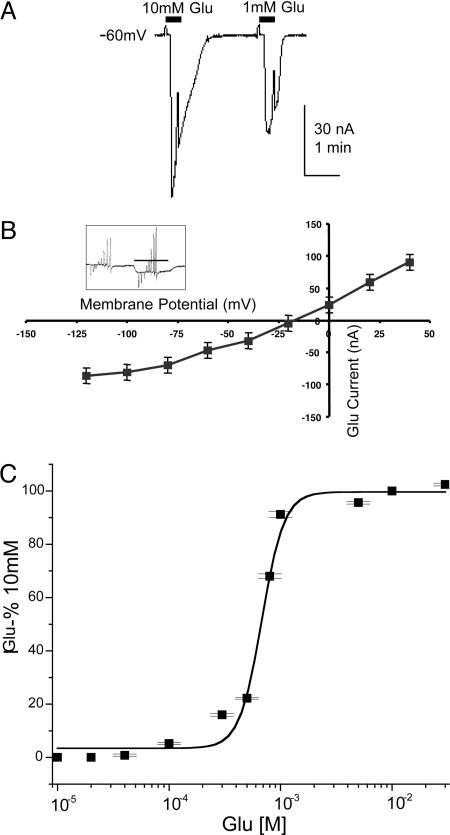
Fig. 1.
Expression of glutamate receptors. (A) Inward currents generated by 10 and 1 mM l-glutamate applied to an oocyte injected with C. elegans mRNA. In this and following figures, horizontal bars denote the beginning and end of exposures to the neurotransmitters. (B) I/V relation (n = 4, two frogs) for glutamate (1 mM) action, showing an equilibrium potential ≈−20 mV. (Inset) The currents generated by 20-mV incremental voltage steps before and in the presence of 1 mM glutamate. Holding potential is −60 mV. (C) Glutamate dose–response relation (n = 6, three frogs).

