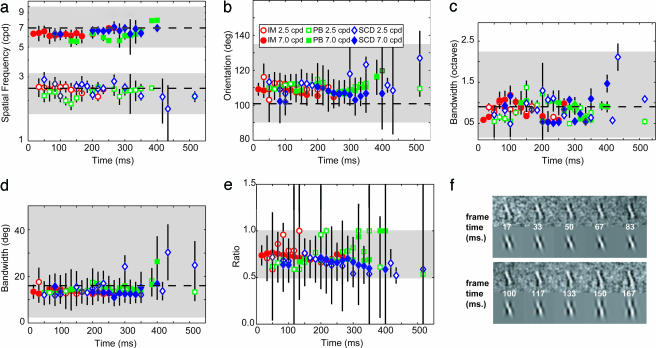
Fig. 2.
Changes in component templates over time. Plots show parameters derived from fitting weighted combinations of CIs; only parameters that met our statistical criteria (described in Methods) are shown. (a) Template SF at 2.5 c/deg (open symbols) and 7.0 c/deg (filled symbols) for three observers. Shaded areas indicate the range over which the fitting procedure could vary; dashed lines are the target SF. Error bars are 95% confidence intervals. (b) Template orientation. (c and d) Template SF-bandwidth (c) and template orientation-bandwidth (d) derived from best fitting Gaussian functions. (e) Relative contribution of the component templates to the decision template. (f) Examples of CIs, and their corresponding best-fitting decision templates, from the first 166 ms of stimulus presentation (observer I.M., SF of 7.0 c/deg). The CI remains largely unchanged over this period.

