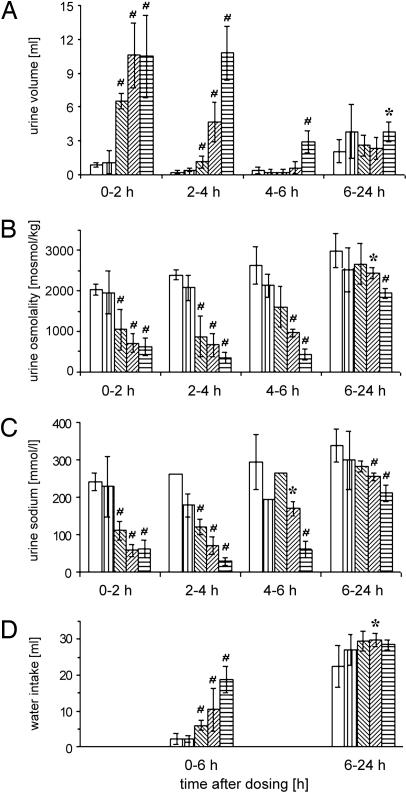
Fig. 5.
Time course and dose–response of NOX-F37 on diuresis and water intake in conscious rats. The different bars represent the following groups: open bars, vehicle (PBS); vertical hatched bars, 2,000 nmol/kg control Spiegelmer; left hatched bars, 80 nmol/kg NOX-F37; right hatched bars, 400 nmol/kg NOX-F37; horizontal hatched bars, 2,000 nmol/kg NOX-F37. Determined parameters are as follows: urine volume (A), urine osmolality (B), urine sodium concentration (C), and water intake (D). Data are the mean ± SEM (n = 5) with the following exceptions: For the urine sodium concentration, only one measured value could be generated in the vehicle group in the interval 2–4 h, and in the control Spiegelmer group and the NOX-F37 group (80 nmol/kg) for the interval 4–6 h. ∗, P < 0.05; #, P < 0.01 indicate statistical significance of effects observed in the treated groups compared with the vehicle group.

