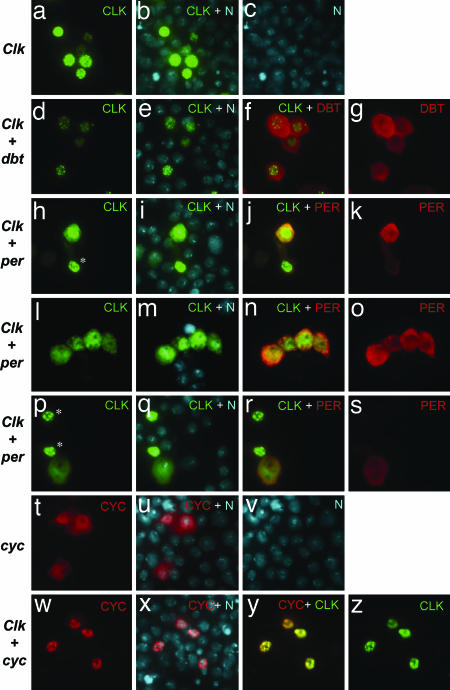
Fig. 4.
CLK cytoplasmic staining is increased in the presence of PER. (a–z) Cells were either individually transfected or cotransfected with the indicated plasmids (listed at left) and processed for in situ detection. Recombinant proteins were visualized as follows: CLK-V5 (FITC, green fluorescence), DBT-3xFLAG (Cy3, red fluorescence), PER and CYC [tetramethylrhodamine B isothiocyanate (TRITC), red fluorescence]. Nuclei were visualized by using Hoechst (blue fluorescence, which was converted to cyan). All images were captured under identical exposure conditions. In the overlay of images visualized with FITC (CLK-V5) and TRITC (PER or CYC), overlap results in a range from orange to yellow. (h–s) Representative examples are shown of the changes in CLK-V5 subcellular distribution by coexpressing PER, whereby strong PER staining is accompanied by significant cytoplasmic staining, a situation not observed in cells expressing low amounts of PER (∗, cells with little or no PER staining).

