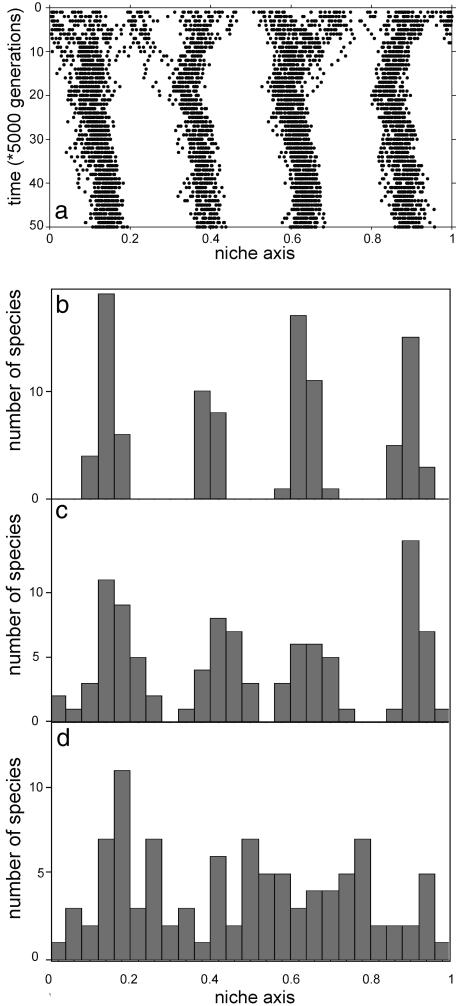
Fig. 3.
Simulated evolution of 100 species (dots in a) that are initially randomly distributed over the niche axis results in convergence toward self-organized lumps of similar species in the presence of density-dependent losses. The carrying capacity of the species is randomly drawn between 9 and 10. (b–d) Resulting frequency distributions of species sizes for increasing values of the parameter representing random variation in other factors that affect evolutionary pressure (w = 0.025, 0.04, and 0.05, respectively). g = 0.5, H = 5, Eq. 2.

