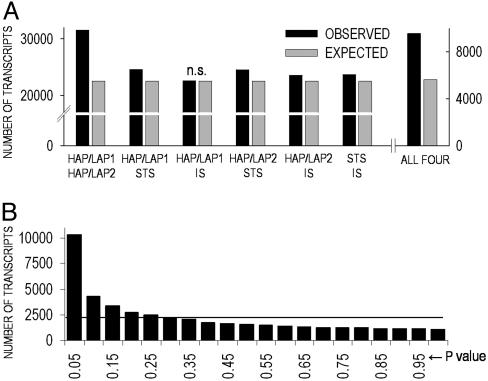
Fig. 1.
Compatibility of data sets for meta-analysis. (A) Number of transcripts regulated in the same direction between any two (left y axis) or all four (right y axis) data sets (P < 0.0001, χ2). n.s., not significant. (B) Frequency distribution of z test P values (x axis) is shown. The solid line represents theoretical chance distribution. IS, Inbred strain.

