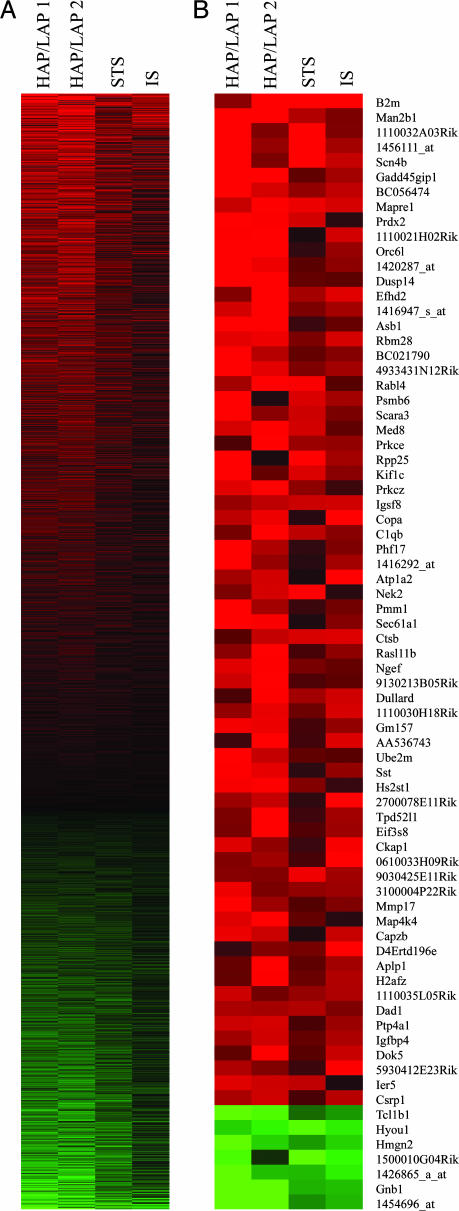
Fig. 2.
Visual representation of microarray data. Columns represent microarray databases used in the meta-analysis, and rows represent transcripts. The filtered criterion was Q < 0.01, and genes were sorted by effect size. (A) Transcripts (2,697) are listed from positive to negative Cohen's d values (effect size). Red indicates a positive effect size and higher expression in preferring mice, and green indicates a negative effect size and lower expression in preferring mice. Black indicates an effect size near zero. (B) The 75 unique transcripts with the highest absolute average effect size (Q < 0.05, ∣d∣ > 1.94). STS, short-term selection; IS, Inbred strains.

