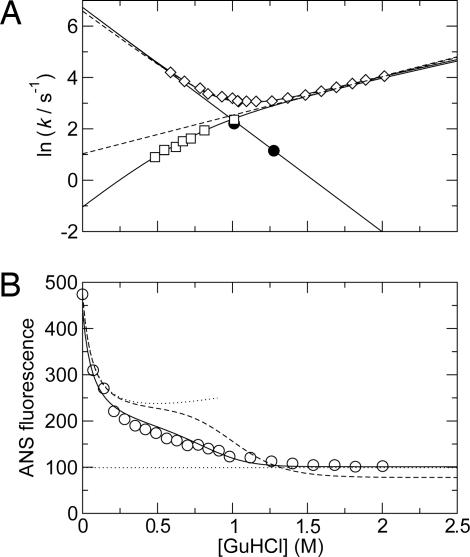
Fig. 3.
Folding kinetics and equilibrium stability of ACBP as a function of [GuHCl] at pH 5.3 and 40°C. (A) Folding kinetics. Shown are the observed rates measured by stopped flow (◇) and the unfolding (□) and folding (•) rates measured by 15N CPMG relaxation dispersions. Solid lines represent fits of unfolding rates from relaxation dispersions to Eq. 3, folding rates from relaxation dispersions to Eq. 4, and the observed folding rate from stopped-flow data to Eq. 5. The dashed lines represent the best fit of the stopped-flow data to a two-state model and the unfolding rates extrapolated from the best fit of the stopped-flow data to the two-state model. See Table 1 for the optimized parameters. (B) Equilibrium stability measured by ANS fluorescence. The solid line represents the fit of the three-state model, and the dashed line represents the fit of the two-state model. The upper and lower dotted lines represent the baselines for N and D, respectively. The baseline for N was estimated as the fluorescence of ACBP/ANS in different concentrations of NaCl, and the baseline for D was estimated as the fluorescence of ANS in the absence of ACBP.

