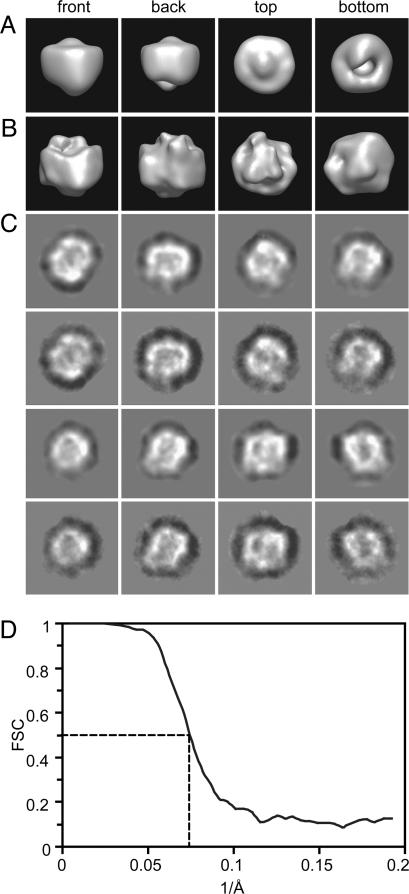
Fig. 2.
3D reconstruction from particle images of the γ-secretase complex. (A) Views of the starting model derived from the random conical tilt method. In this method, the tilt angle needed for calculating the 3D map is determined experimentally. (B) Corresponding views of the refined 3D map. (C) A gallery of selected reprojections of the reconstructed 3D map (rows 1 and 3) and their corresponding class averages (rows 2 and 4). (D) The Fourier shell correlation (FSC) curve suggests a resolution of 15 Å.

