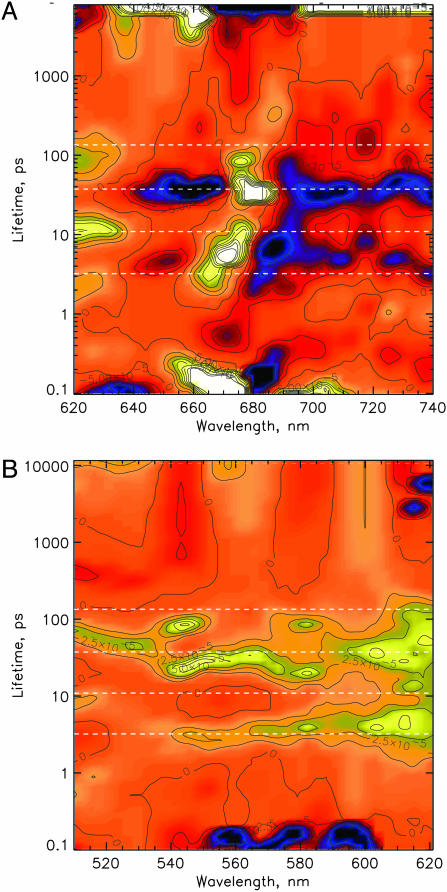
Fig. 1.
LFD maps of the transient absorbance changes in the Qy (A) and the Qx (B) ranges of the chlorins in the isolated D1-D2 RC (excitation at 681 nm). The lifetimes are shown on a logarithmic scale. Yellow indicates positive amplitudes reflecting either the rise of a bleaching or the decay of an absorption; blue indicates negative amplitudes reflecting either the decay of a bleaching or the rise of an absorption. The dashed lines in the LFD maps represent the lifetimes obtained from the kinetic models.

