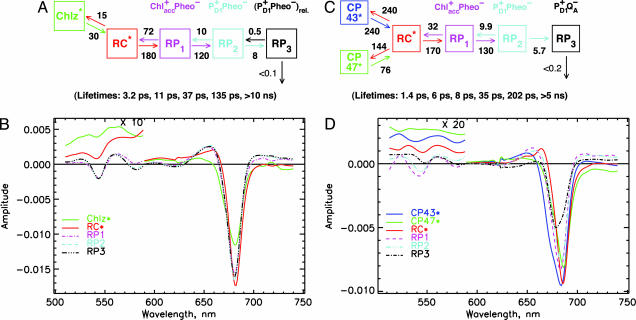
Fig. 3.
Kinetic compartment models and SADS for isolated RC (A and B) and the intact PSII core (C and D). (A and B) Kinetic model with rate constants (ns−1) and resulting lifetimes (bottom of image) (A) and corresponding SADS (note the change in scale near 590 nm) (B) for the isolated D1-D2 RC. (C and D) Kinetic model with rate constants (ns−1) and resulting lifetimes (bottom) (C) and the corresponding SADS (note the change in scale near 590 nm) (D) for the intact PSII cores. The rate constants have an estimated error of ≈15%.

