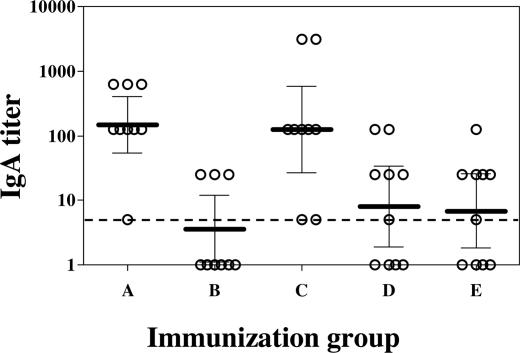
Fig. 4.
Stx2-specific fecal IgA as measured by ELISA. Each circle represents the IgA titer of an individual mouse; the bar represents the geometric mean of the titers obtained from the group. The dashed line indicates the limit of detection, and the error bracket represents the 95% confidence interval. Unpaired t tests were performed between group pairs (see Table 1): A–B (P < 0.05), C–D (P > 0.05), C–E (P > 0.05), and D–E (P > 0.05).

