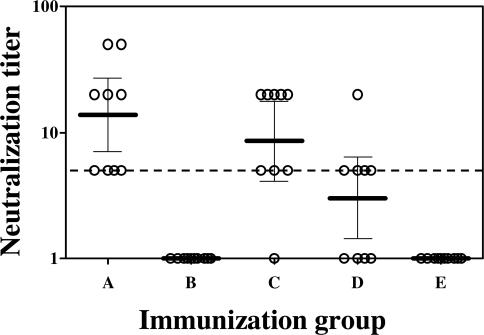
Fig. 5.
Neutralization of Stx2 Vero cell cytotoxicity with mouse antisera. Each circle represents the neutralization titer of the serum from an individual mouse. The dashed line represents the limit of detection. The bar represents the geometric mean of neutralization titers obtained from each group, and the error bracket represents the 95% confidence interval. Unpaired t tests were performed between group pairs (see Table 1): A–B (P < 0.05), C–D (P < 0.05), C-E (P < 0.05), and D–E (P < 0.05).

