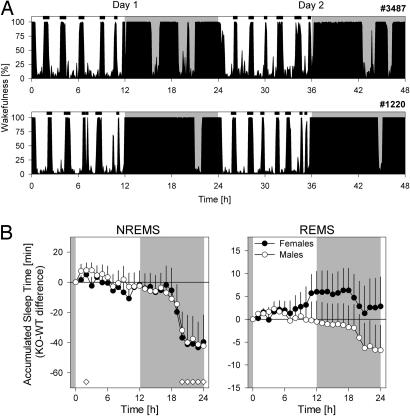
Fig. 1.
Sleep–wake distribution during baseline. (A) Examples of wake distribution in baseline for two mice (no. 3487, WT female; no. 1220, KO male). Black area depicts percent wakefulness in 5-min intervals. Note the highly regular occurrence of sustained waking bouts during the rest period. Periodogram analysis revealed a significant 128-min periodicity in all individuals. Ultradian sleep–wake patterns of such periodicity have not been described previously. (B) Genotype comparison of the accumulation of sleep time in baseline. NREMS (Left) and REMS (Right) values in KO mice were expressed relative to WT. Indicated are hourly increments averaged over 2 baseline days (±1 SE of the difference) for females (filled symbols) and males (open symbols). Diamonds indicate significant genotype differences (P < 0.05, t tests). Gray areas denote dark periods.

