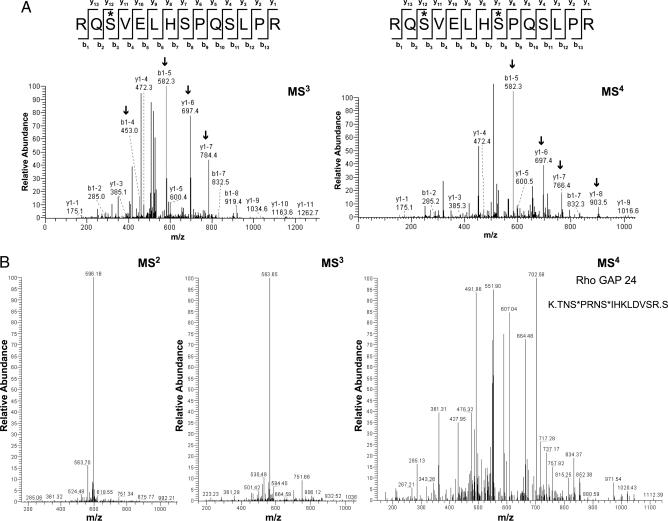
Fig. 2.
Identification and confirmation of phosphorylation sites using LC-MSn neutral loss scanning. (A) Confirmation of AQP2 phosphorylation on S256 (∗) from an MS3 spectrum (Left). Arrows indicate specific peaks in the mass spectrum that aided in distinguishing the actual site of phosphorylation from other potential sites. Confirmation of phosphorylation on S256 as well as identification of a new site, S261, for a doubly phosphorylated AQP2 peptide from an MS4 spectrum (Right). (B) Comparison of different MS levels for Rho GTPase activating protein 24, a phosphoprotein that was identified solely on the quality of its MS4 spectrum. In both A and B, asterisks indicate residues that were phosphorylated in the full MS scan but subsequently underwent neutral loss leaving a modified original residue mass without water (−18 Da).

