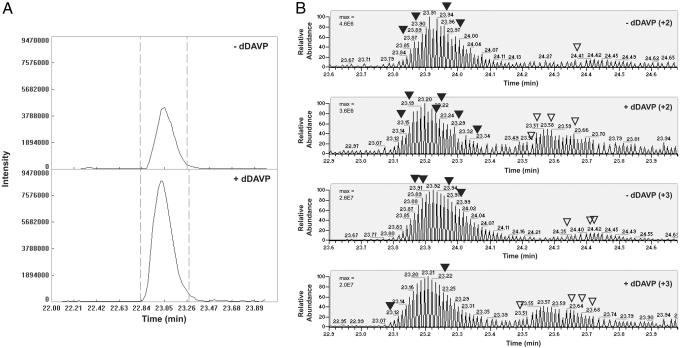
Fig. 4.
MS quantification of AQP2 phosphorylation in response to dDAVP treatment. (A) Aligned chromatogram plots of overall peptide abundance for AQP2 phosphorylated at both S256 and S261. Retention time in minutes (x axis) and intensity (y axes). The doubly phosphorylated AQP2 peptide increased an average of 2.67-fold with dDAVP treatment. Values were calculated by using the “area under the curve” between the two cutoff lines (dashed lines). (B) Targeted ion selection (TIS) analysis of singly phosphorylated AQP2 peptides. Labeled peaks corresponding to either pS261 (▾) or pS256 (▿) indicate spectra that were confirmed by manual validation. Max, maximum peak intensity.

