Fig. 4.
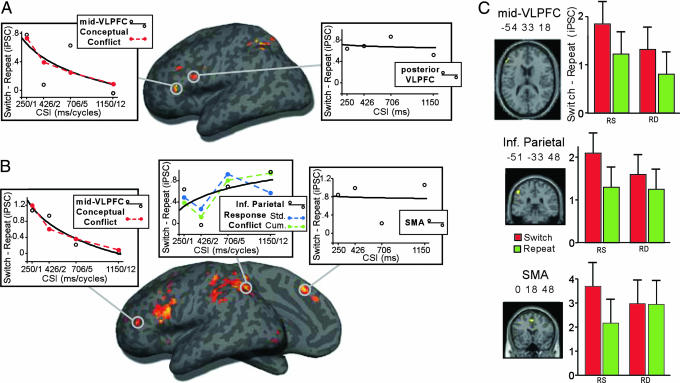
fMRI results from Experiment 2. (A) Surface rendering of switch > repeat at the shortest CSI (250 ms). Plotted are neural switch costs across CSI from ROI analyses of left mid-VLPFC (−51 27 6) and posterior VLPFC (−45 6 27). (B) The contrast of switch vs. repeat collapsed across CSI. Plotted are changes in neural switch cost from ROIs in left mid-VLPFC (−54 33 18), inferior parietal cortex (−51 −33 48), and SMA (0 18 48). Also depicted are linearly scaled conflict signals (dashed lines) from conceptual (red) and response [blue (standard) and green (cumulative)] layers of CAM-TS. (C) Bar graphs depict enhancement of switch costs during RS vs. RD trials split by switch (red bar) and repeat (green bar) from ROIs in left mid-VLPFC (−54 33 18), inferior parietal cortex (−51 −33 48), and SMA (0 18 48).

