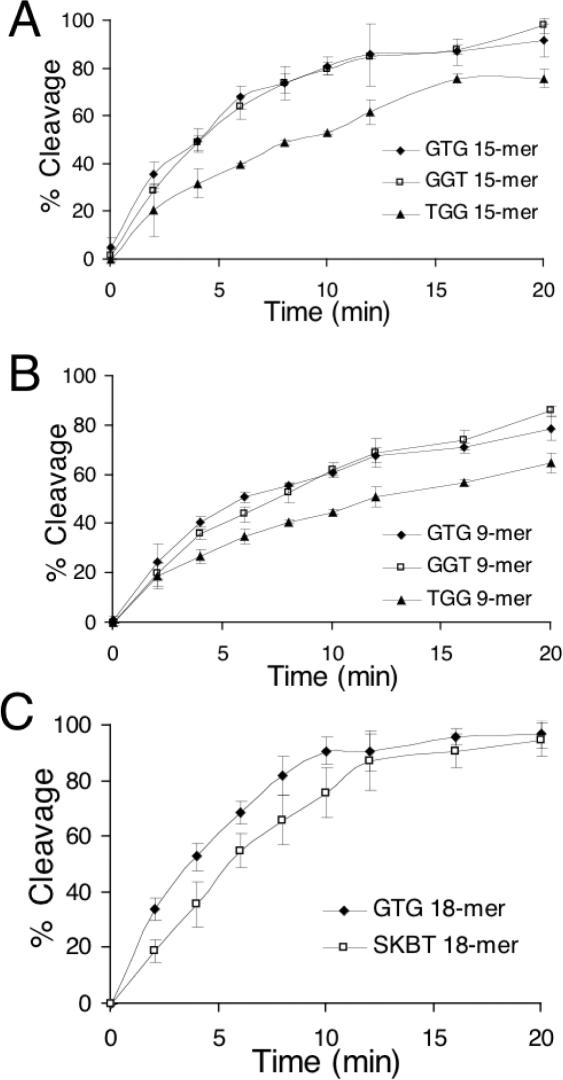
Figure 5.
Time course of RecA coprotease activity with three different TGG-repeating sequences and the top in vitro-selected sequence. The percentage cleavage of cI93–236 in the presence of TGG, GTG and GGT-repeating sequences is plotted versus time for (A) 15mer oligonucleotides, and (B) 9mer oligonucleotides. GTG and GGT give significantly higher coprotease activity than TGG. At early time points, GTG gives slightly higher coprotease activity than GGT. (C) Comparison of a GTG-repeating 18mer and the top in vitro-selected sequence, 5′-GCGTGTGTGGTGGTGTGC-3′ (SKBT) (14,15). The value at each time-point is the average of three separate reactions and the error bars show the standard deviations.

