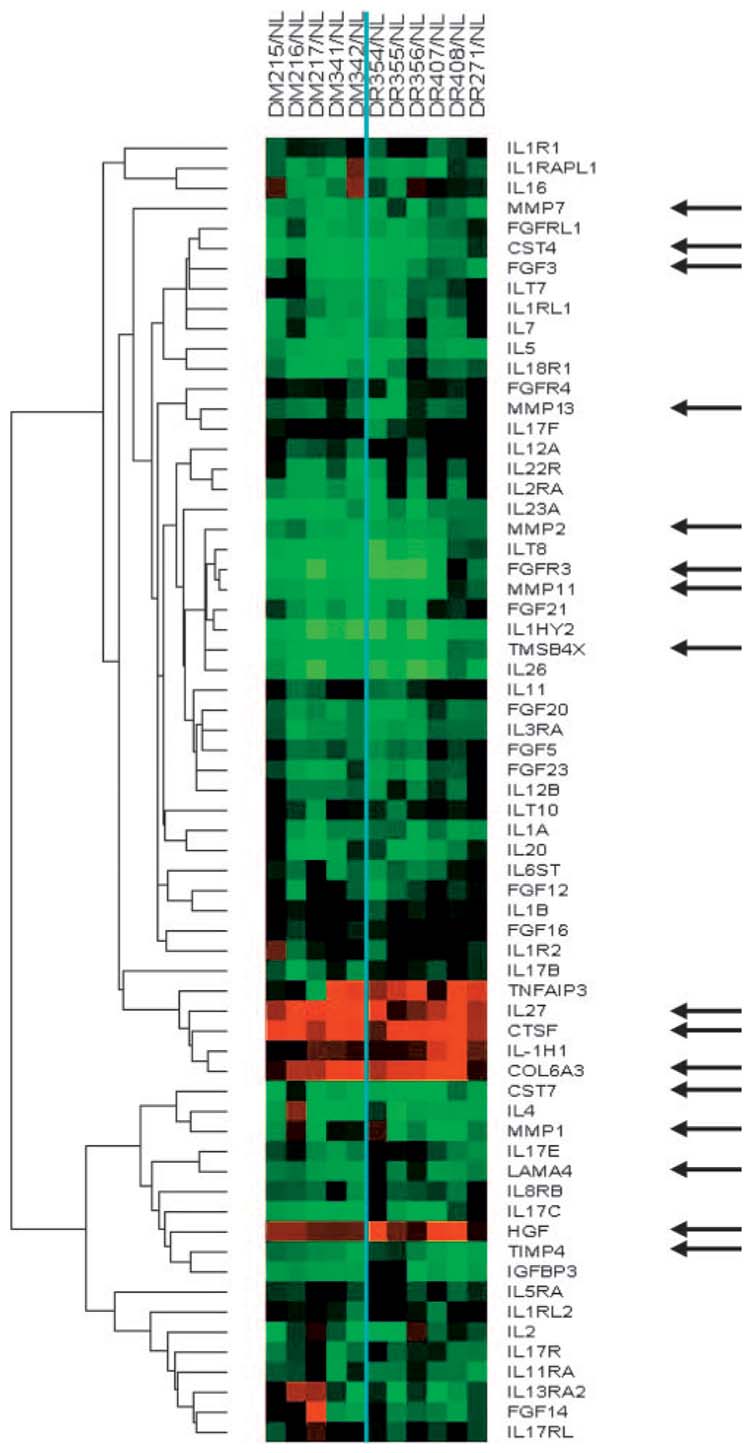
FIGURE 1.

Cluster analysis of gene microarray data using ex vivo corneas. Each column shows proteinase and growth factor/cytokine-related genes in an individual diabetic (DM) or DR cornea that are significantly changed compared with normal (NL) corneas. The vertical line divides the DM and DR groups. For each gene in a DM or DR sample, the signal intensity is presented as a ratio to normal (NL) signal at the same spot on the same array. (green) Gene downregulation in diabetic sample compared with normal. (black) No change. (red) Gene upregulation in diabetic sample compared with normal sample. Arrows point to individual genes of interest. For comparison, type VI collagen α3 chain (COL6A3) and laminin α4 chain (LAMA4) genes are also shown. Note the consistent changes of selected genes across the DM and DR groups. CST4, cystatin S; CST7, cystatin F; CTSF, cathepsin F; IL27, interleukin-27; TMSB4X, X-linked T β4.
