FIGURE 2.

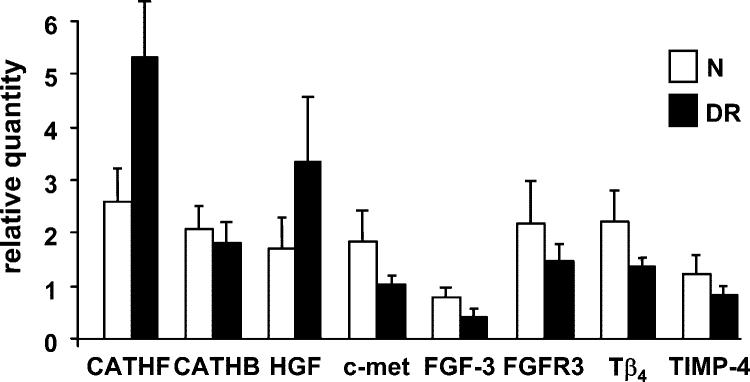
QPCR data for select genes of interest. Data for ex vivo corneas are shown. Results with organ-cultured corneas were generally similar. N, normal; cath, cathepsin. Bars represent SEM.

QPCR data for select genes of interest. Data for ex vivo corneas are shown. Results with organ-cultured corneas were generally similar. N, normal; cath, cathepsin. Bars represent SEM.