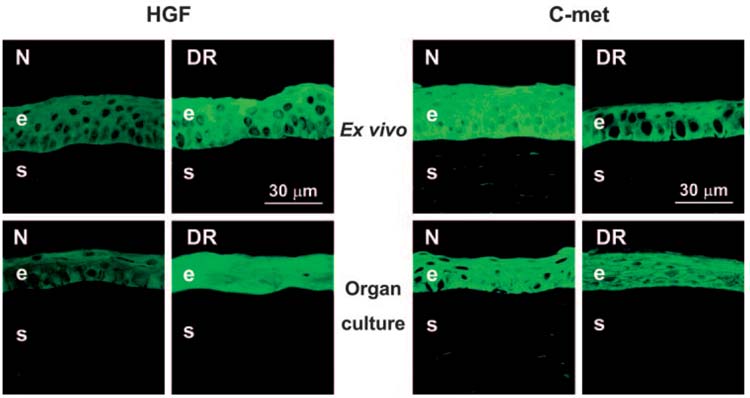
FIGURE 4.

Distribution of HGF and c-met in ex vivo and organ-cultured normal (N) and DR corneas. HGF is increased in DR corneal epithelium (left panels, pAb AF294), but c-met shows a decrease (right panels, pAb C-28). Ex vivo and organ-cultured corneas have similar distributions of both components. Indirect immunofluorescence. e, epithelium; s, stroma.
