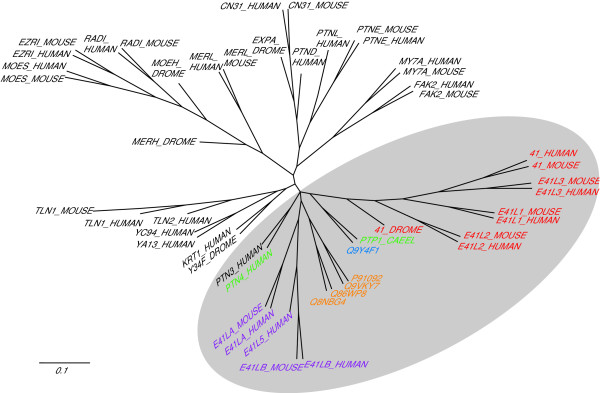
Figure 3.

Phylogenetic tree of lobe B of FERM domains. This tree was produced by Maximum Likelihood (Phylip proml) analysis of a non-redundant selection of FERM domain lobe B sequences. The grey shading lies over proteins that contain both FERM and FA regions: proteins outside the shading contain FERM domains, but not the FA. FERM/FA region proteins are colour coded to indicate their class of sequence as given in Fig 2: (a) red (b) orange (c) green (d) blue (e) purple.
