Figure 1.
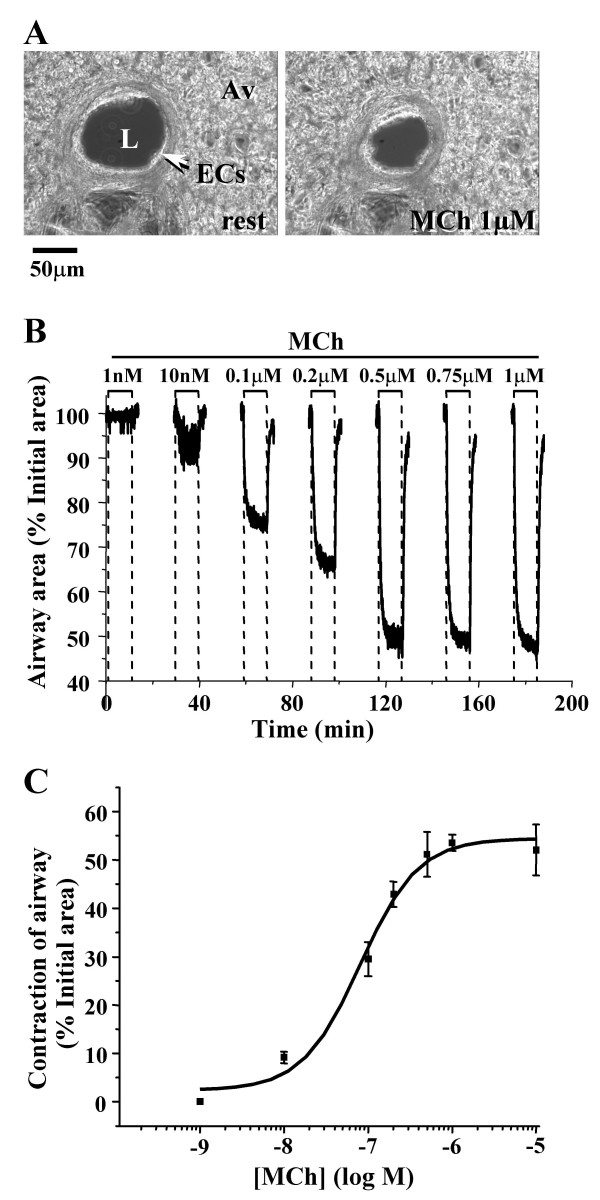
The contractile response of airways in mouse lung slices to MCh. (A) Low magnification phase-contrast images (scale bar = 50 μm) of the same airway before and 5 minutes after stimulation with 1 μM MCh. L, airway lumen; ECs, epithelial cells; Av, alveolar tissue. (B) The relative change in the area of the airway lumen (% of the initial area) in response to MCh from 1 nM to 1μM. During the interval between each application of MCh (15 min) the airway area was not recorded but the slice was continually washed with sHBSS. (C) The concentration-dependent contractile response of airways to MCh. Each point represents 5 to 7 experiments (mean ± S.E.) in different airways from at least 3 mice. The data were fitted with a logistic function.

