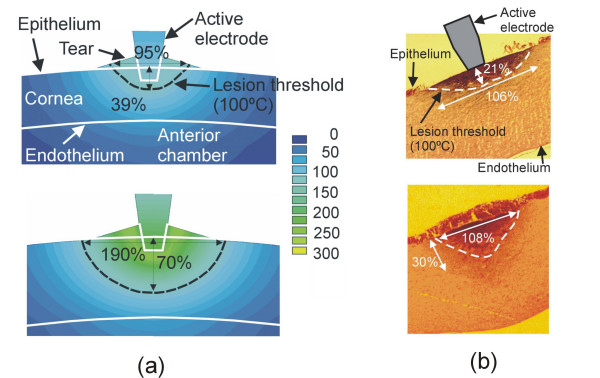
Figure 4.
Example of experimental validation of the theoretical models by comparing computed temperature distributions and histologic samples. (a) Temperature distributions in the cornea during RF heating using constant voltage (scale in °C). Top: 16 V after 1 s. Bottom: 21 V after 1 s. (b) Cross-section of corneas heated with an active electrode of 200 μm diameter (hematoxylin and eosin, ×40). Top: 16 V after 1 s. Bottom: 21 V after 1 s. The lesion dimensions (central depth and surface width) were assessed using the coagulation contour, and were expressed as % of cornea thickness. In this case, the 100°C isothermal line was used to compare the experimental and computed results since it had been observed that the coagulation contour occurs in the temperature range around 100°C using short heating times [49].

