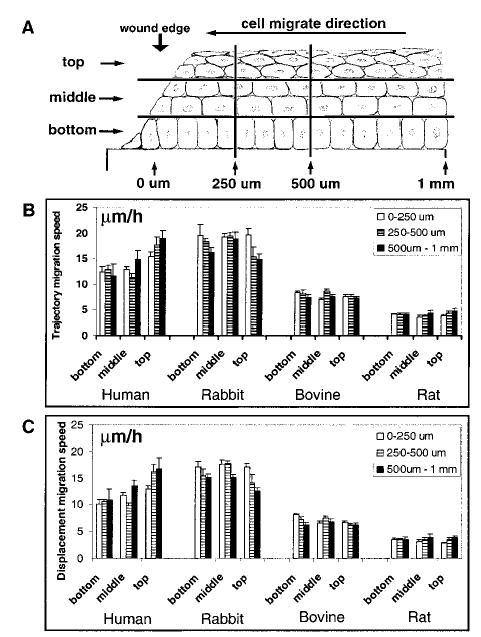
Figure 6.

Epithelial cells from different layers and at different distances from the wound edge moved into the wound at the same speed. A) Schematic diagram showing 9 regions from which cell migrations were tracked. The wound site is at the left and corneal epithelial cells migrated to the left to heal the wound. In the horizontal direction, the first 1 mm from the wound edge was separated into 3 zones; 0–250 μm, 250–500 μm, and 500 μm–1 mm. In the vertical direction, the whole corneal epithelium was divided into 3 zones: top, middle, and bottom; one layer of cells was selected from each zone for statistical analysis (Z distance range from 3 to 4 μm). Cell migrations in the 9 different zones were tracked simultaneously in 3-dimensional time-lapse recordings. B, C) Trajectory and displacement migration speed of corneal epithelial cells. Although migration speed was slightly different among different layers of the cornea in some experiments (for example, human cornea top layer compared with other layers), statistically the migration speed was not significantly different among different layers in most experiments. Cells in different zones in the horizontal plane had similar migration speeds (cf. 0–250 μm, 250–500 μm, and 500 μm–1 mm area). Significant differences in migration speed were found between species.
