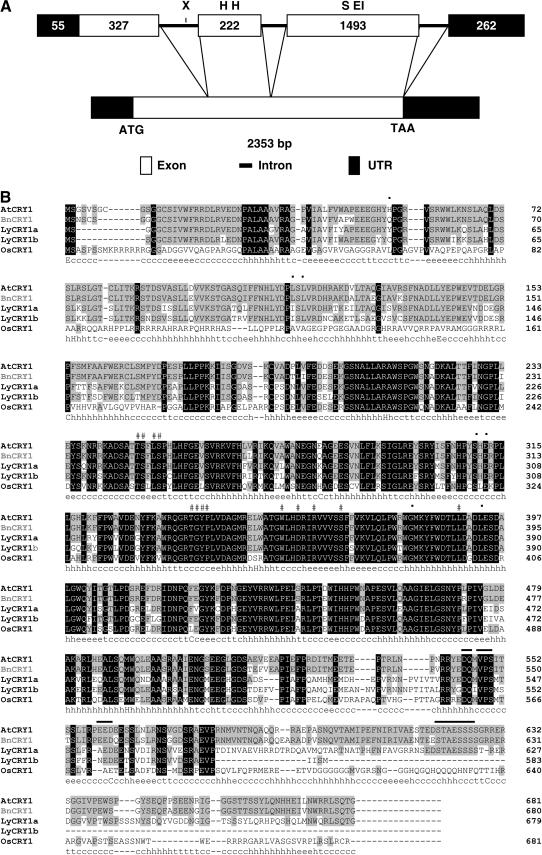
Figure 1.
A, Schematic diagram representing the alignment of BnCRY1 cDNA with the corresponding gene. Exon borders are indicated with a line connecting the cDNA and the exons. Numbers depict the size of UTR and exons. Restriction sites for EcoRI (EI), HindIII (H), SalI (S), and XbaI (X), which have been used for Southern analysis, are indicated on the horizontal bar representing gene structure. B, Amino acid sequence alignment of five representative plant cryptochromes using ClustalW. Black-boxed and gray-boxed letters represent residues that are identical in all or most cryptochromes, respectively. # and • symbols indicate the residues interacting with FAD and MTHF, respectively. Lines above the sequences mark the DAS domain present in the C-terminal region. The predicted secondary structure of BnCRY1 as determined using SOPM is shown below the alignment data and consists of α-helices (h), extended β-sheets (e), and coil (c) regions.

