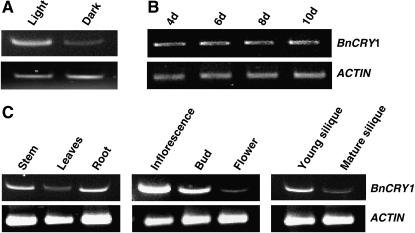
Figure 4.
Comparative RT-PCR analysis to show light and developmental regulation, and tissue-specific expression of BnCRY1. A shows the transcript levels in 6-d-old dark- and light-grown seedlings. B and C show the BnCRY1 transcript levels at different developmental stages and in various tissues/organs, respectively. The inflorescence tissue consisted of inflorescence meristem and young emerging floral buds. ACTIN transcript was used as internal control.

