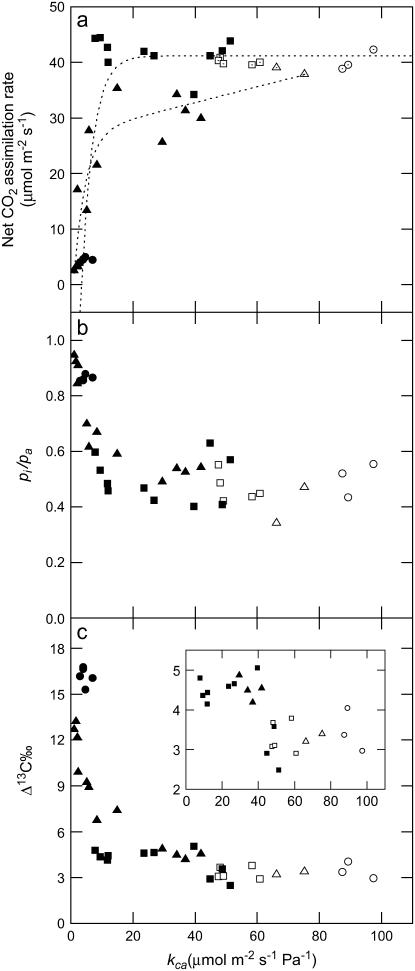
Figure 3.
Net CO2 assimilation rate, the ratio of intercellular to ambient pCO2 (pi/pa), and carbon isotope discrimination (Δ13C) as a function of the rate constant of leaf CA (kCA μmol m−2 s−1 Pa−1). The inset in c shows the expanded scale of Δ13C where net CO2 assimilation is relatively constant. Each point represents a measurement made on a different plant grown in a glasshouse at ambient CO2 or in a growth cabinet at 1% CO2: wild-type plants grown at ambient CO2 (□); anti-CA plants grown at ambient CO2 (▪); wild-type grown at 1% CO2 (○, ▵); and anti-CA plants grown at 1% CO2 (•, ▴). Measurements were made at 2,000 μmol quanta m−2 s−1, leaf temperature of 30°C, and an inlet CO2 concentration of either 38 Pa in air (▵, ▴) or 52 Pa of CO2 in a 90.5 kPa of N2 and 4.8 kPa of O2 gas mixture (□○, ▪•). The lines represent the best fit for all measurements (wild-type and anti-CA plants) made at either 38 or 52 Pa of CO2.

