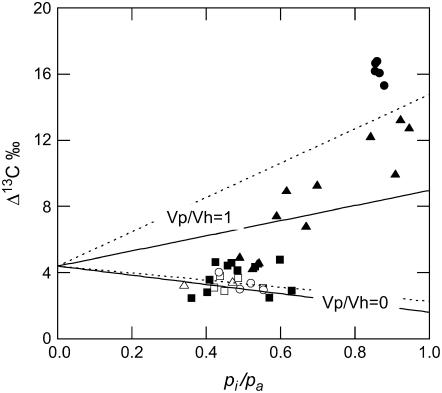
Figure 4.
Carbon isotope discrimination (Δ13C) as a function of the ratio of intercellular to ambient pCO2 (pi/pa). The white symbols are wild-type plants and the black symbols are anti-CA plants. Other symbols and measurement conditions are as described in Figure 3. The lines represent the theoretical relationship of Δ13C and pi/pa, where φ = 0.24, the ratio of the PEPC carboxylation to the CO2 hydration reaction (Vp/Vh) is either 0 or 1, and the b4 parameter is calculated with the catalyzed (solid lines, b4 = −5.7 + 7.9 Vp/Vh) and uncatalyzed (dotted lines, b4 = −4.5 + 12.5 Vp/Vh) CO2 and HCO3− hydration and dehydration fractionation factors. gw was assumed to be large such that pi = pm.

