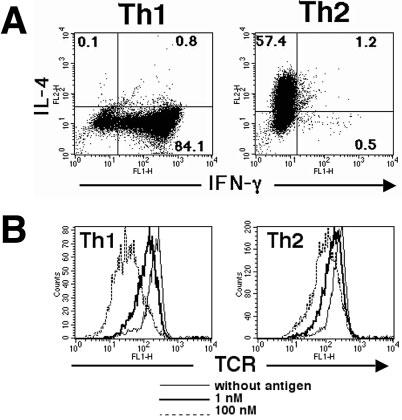
Figure 1.

Differential TCR down-modulation among Th1 and Th2 cells expressing the same TCR chains. 5C.C7 TCR-transgenic T cells were polarized in vitro to produce Th1 and Th2 effector cells. Rested Th1 and Th2 cells were stimulated with P13.9 and PCC88–104 (1 μM) for 5 h and then analyzed for cytokine production (A). These Th1 and Th2 cells were then exposed to antigen-presenting cells pulsed with either 1 or 100 nM MCC88-103 peptide and the surface expression of Vβ3-containing TCR was assessed 5 h later by flow cytometry (B). The mean fluorescent intensities for untreated cells, cells exposed to 1 nM pulsed presenting cells, or cells exposed to 100 nM pulsed presenting cells, respectively, were 215, 135, and 47 for Th1 cells and 246, 173, and 120 for Th2 cells. Results are representative of eight experiments.
