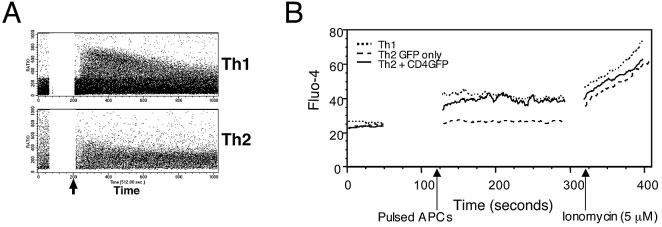
Figure 6.

Th1-like pattern of TCR-induced intracellular Ca2+ elevation in Th2 cells with restored CD4 expression. (A) Polarized Th1 and Th2 5C.C7 T cells were loaded with the indicator dye Indo-1 and analyzed for changes in intracellular Ca2+ by FACS following stimulation with antigen-presenting cells pulsed with 10 μM MCC peptide (arrows). (B) Polarized Th1, Th2, and CD4-EGFP-positive Th2 5C.C7 T cells were loaded with the calcium indicator Fluo-4, and intracellular Ca2+ levels were analyzed by FACS. A 50-s baseline was recorded before addition of antigen-presenting cells pulsed with 100 μM PCC88–104 peptide. After 90 s of cell contact, the intracellular Ca2+ levels were measured again (first arrow) followed by exposure to ionomycin (5 μM; second arrow). Results are representative of five experiments.
